
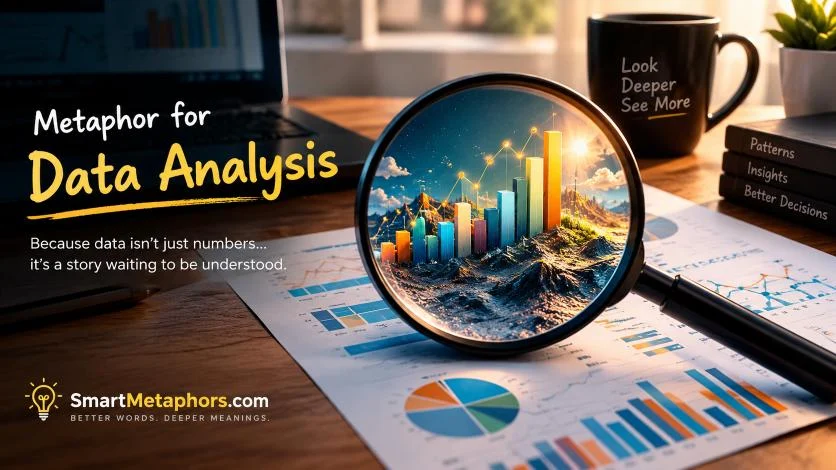
A metaphor for data analysis can make a technical process easier to understand, especially when explaining statistics, research, business intelligence, or complex datasets to a general audience.
Data analysis is more than numbers sitting inside a spreadsheet. It is a process of asking questions, finding patterns, testing ideas, discovering relationships, and turning raw information into useful knowledge.
That is why metaphors can be powerful. They give an abstract analytical process a familiar shape that readers can quickly understand.
Key Takeaways
- Data analysis can be compared to exploration, investigation, sorting, or problem-solving.
- Different metaphors highlight different parts of the analytical process.
- Simple metaphors are useful when teaching beginners.
- Professional metaphors can make presentations and reports more engaging.
- The strongest metaphor matches the specific analytical task.
What Is a Metaphor?
Definition of a Metaphor
A metaphor directly describes one thing as another to create a meaningful comparison.
For example:
“Data analysis is a treasure hunt.”
Data analysis is not literally a treasure hunt. The metaphor suggests that useful insights are hidden within information and must be discovered.
Why Metaphors Help Explain Data
Technical subjects can become difficult when they rely only on specialized terminology.
A well-chosen metaphor gives readers a mental model.
For example:
“The dataset is a forest, and analysis is the trail that helps us navigate it.”
This makes the relationship between a large dataset and the analytical process easier to visualize.
How Metaphors Express Data Analysis
Data analysis involves several stages, and each stage can inspire a different metaphor.
- Collecting data can be gathering clues.
- Cleaning data can be washing away noise.
- Organizing data can be sorting a library.
- Exploring data can be navigating a map.
- Finding patterns can be connecting dots.
- Testing ideas can be examining evidence.
- Reporting results can be turning evidence into a story.
The best metaphor does not merely make data sound interesting. It explains something real about the analytical process.
Metaphor for Data Analysis: Creative Examples
Exploration Metaphors
Data analysis is a treasure hunt.
Meaning: Valuable insights are hidden within large amounts of information.
Best Use: Business presentations, articles, and beginner explanations.
Tone: Adventurous
Data analysis is a journey through an unknown landscape.
Meaning: Analysts explore information without always knowing what they will discover.
Best Use: Research and exploratory analysis.
Tone: Thoughtful
Data is a map waiting to be explored.
Meaning: Data contains information that can reveal directions and relationships.
Best Use: Educational writing.
Tone: Inspirational
An analyst is a navigator in a sea of numbers.
Meaning: Analysts help make sense of large and complicated datasets.
Best Use: Business or technology writing.
Tone: Professional
Data analysis is a flashlight in a dark room.
Meaning: Analysis reveals information that was previously difficult to see.
Best Use: Explaining the value of analytics.
Tone: Clear and powerful
Investigation Metaphors
Data analysis is detective work.
Meaning: Analysts examine evidence to uncover explanations and patterns.
Best Use: Research, journalism, and storytelling.
Tone: Investigative
Every dataset is a case waiting to be solved.
Meaning: Data can contain clues that lead toward an answer.
Best Use: Educational content.
Tone: Dramatic
Numbers are clues scattered across a crime scene.
Meaning: Individual data points become meaningful when examined together.
Best Use: Creative presentations.
Tone: Dramatic
Analysis is the detective’s magnifying glass.
Meaning: Analytical techniques allow people to examine details closely.
Best Use: Explaining analytical tools.
Tone: Educational
Patterns are fingerprints left behind by behavior.
Meaning: Data patterns can reveal underlying actions or trends.
Best Use: Marketing, customer analysis, and behavioral research.
Tone: Analytical
Problem-Solving Metaphors
Data analysis is a puzzle.
Meaning: Analysts combine separate pieces of information to understand the bigger picture.
Best Use: Beginner-friendly explanations.
Tone: Simple
Every data point is a piece of the puzzle.
Meaning: Individual observations contribute to a larger conclusion.
Best Use: Education and presentations.
Tone: Clear
Analysis is building a picture from scattered pieces.
Meaning: Analysts transform disconnected information into an understandable result.
Best Use: Research writing.
Tone: Thoughtful
Data is a locked door, and analysis is the key.
Meaning: Analytical methods unlock useful information.
Best Use: Business and technology content.
Tone: Powerful
Analysis is a bridge between questions and answers.
Meaning: Data analysis connects a problem with evidence-based conclusions.
Best Use: Academic and professional writing.
Tone: Professional
Pattern-Finding Metaphors
Data analysis is connecting the dots.
Meaning: Analysts identify relationships between separate observations.
Best Use: Beginner explanations.
Tone: Simple
Patterns are footprints across a field of numbers.
Meaning: Trends leave recognizable signs within datasets.
Best Use: Creative data writing.
Tone: Poetic
The dataset is a woven fabric.
Meaning: Individual data points combine to create a larger pattern.
Best Use: Research and analytical storytelling.
Tone: Elegant
Trends are waves moving through the data.
Meaning: Patterns rise, fall, and change over time.
Best Use: Time-series analysis and business reports.
Tone: Visual
Correlations are threads connecting distant points.
Meaning: Relationships can link seemingly separate variables.
Best Use: Statistical explanations.
Tone: Analytical
Data Cleaning Metaphors
Data cleaning is washing mud from a window.
Meaning: Removing errors and unwanted information makes the underlying picture clearer.
Best Use: Beginner education.
Tone: Visual
Cleaning data is clearing weeds from a garden.
Meaning: Unnecessary or incorrect information can hide useful patterns.
Best Use: Educational articles.
Tone: Natural
Raw data is a rough diamond.
Meaning: Raw information may contain valuable insights but needs preparation before its value becomes clear.
Best Use: Business and analytics writing.
Tone: Inspirational
Data cleaning is polishing a mirror.
Meaning: Cleaner data provides a clearer reflection of reality.
Best Use: Professional presentations.
Tone: Elegant
Messy data is a tangled ball of thread.
Meaning: Disorganized information is difficult to interpret until it is carefully structured.
Best Use: Technical explanations.
Tone: Relatable
Statistical Analysis Metaphors
Statistics are the measuring tape of data.
Meaning: Statistical methods help quantify patterns and differences.
Best Use: Beginner explanations.
Tone: Educational
An average is the center of gravity in a dataset.
Meaning: The mean provides a central point around which observations can be understood.
Best Use: Statistics education.
Tone: Academic
Variance is the breathing room between data points.
Meaning: It represents how widely values spread around the center.
Best Use: Beginner statistics lessons.
Tone: Accessible
Probability is the weather forecast of uncertainty.
Meaning: Probability helps estimate how likely different outcomes are.
Best Use: Statistics and data science writing.
Tone: Creative
A statistical model is a lens.
Meaning: A model provides a particular way of viewing and interpreting data.
Best Use: Data science and research.
Tone: Professional
Storytelling Metaphors for Data
Data is a story written in numbers.
Meaning: Numbers can reveal events, behaviors, and trends when interpreted correctly.
Best Use: Data journalism and presentations.
Tone: Creative
Analysis turns numbers into a narrative.
Meaning: Analysts transform raw information into understandable conclusions.
Best Use: Business storytelling.
Tone: Professional
A dataset is a book with missing chapters.
Meaning: Data often provides only part of the story and requires careful interpretation.
Best Use: Research writing.
Tone: Thoughtful
Charts are windows into the data.
Meaning: Visualizations allow readers to see patterns more easily.
Best Use: Data visualization content.
Tone: Clear
Insights are the plot twists hidden in the numbers.
Meaning: Analysis can reveal unexpected findings.
Best Use: Social media, presentations, and creative content.
Tone: Engaging
Professional Metaphors for Data Analysis
Data analysis is a compass for decision-making.
Meaning: Insights help organizations choose a direction.
Best Use: Business writing.
Tone: Professional
Analytics is the engine behind informed decisions.
Meaning: Analysis provides the power that supports better decisions.
Best Use: Corporate content.
Tone: Strong
Data is the raw material, and analysis is the workshop.
Meaning: Useful insights require processing and interpretation.
Best Use: Business education.
Tone: Professional
An analytical model is a pair of glasses.
Meaning: Models help decision-makers see particular aspects of a problem more clearly.
Best Use: Data science articles.
Tone: Professional
Insights are signposts on the road to better decisions.
Meaning: Analytical findings guide future actions.
Best Use: Business reports and strategy writing.
Tone: Strategic
Simple Metaphors for Beginners
Data analysis is a magnifying glass.
Meaning: It helps us examine information closely.
Best Use: Students and beginners.
Tone: Simple
Data is a box of clues.
Meaning: Information contains pieces that can help answer questions.
Best Use: Classroom explanations.
Tone: Friendly
Analysis is sorting a messy drawer.
Meaning: Analysts organize information so it becomes easier to understand.
Best Use: Beginner lessons.
Tone: Casual
A dataset is a puzzle board.
Meaning: Different pieces of information fit together to create a larger picture.
Best Use: Educational writing.
Tone: Simple
Analysis is turning numbers into answers.
Meaning: The analytical process converts raw information into useful conclusions.
Best Use: Very basic explanations.
Tone: Direct
Metaphor vs Simile
What Is a Metaphor?
A metaphor makes a direct comparison.
“Data analysis is a treasure hunt.”
What Is a Simile?
A simile uses “like” or “as” to make a comparison.
“Data analysis is like a treasure hunt.”
Side-by-Side Examples
| Metaphor | Simile |
|---|---|
| Data is a treasure map. | Data is like a treasure map. |
| Analysis is a flashlight. | Analysis is like a flashlight. |
| A dataset is a puzzle. | A dataset is like a puzzle. |
| Analytics is a compass. | Analytics is like a compass. |
A metaphor generally feels more direct and confident, while a simile makes the comparison more explicit.
How to Choose the Right Metaphor for Data Analysis
Consider Your Audience
A metaphor for a data scientist can be more technical than one intended for a fifth-grade student.
For beginners, use familiar concepts such as:
- Puzzles
- Maps
- Magnifying glasses
- Clues
- Stories
For professionals, concepts such as:
- Compasses
- Lenses
- Engines
- Bridges
- Navigation
may work better.
Match the Analytical Stage
Do not use the same metaphor for every part of data analysis.
For example:
Data cleaning:
“Polishing a mirror.”
Pattern discovery:
“Connecting the dots.”
Decision-making:
“Using a compass.”
This creates a more precise explanation.
Match the Tone
A business report needs controlled imagery, while a blog post can use playful comparisons.
Expert Writing Tips
Start With the Purpose
Before creating a metaphor, ask:
What does the reader need to understand about data analysis?
If the goal is to explain discovery, use exploration imagery.
If the goal is to explain accuracy, use measurement imagery.
If the goal is to explain decision-making, use navigation imagery.
Avoid Making Data Sound Magical
Good metaphors simplify a real concept. They should not suggest that analysis automatically produces perfect answers.
For example, “Data analysis is a crystal ball” can be misleading because analytics does not guarantee knowledge of the future.
A better choice is:
“Data analysis is a compass for uncertain roads.”
This communicates guidance without promising certainty.
Make the Comparison Specific
Instead of:
“Data analysis is powerful.”
Try:
“Data analysis is a flashlight that reveals patterns hidden in the dark.”
The second version gives readers something concrete to imagine.
Common Mistakes to Avoid
Using Generic Metaphors
A metaphor should contribute meaning rather than simply decorate a sentence.
Confusing Analysis With Data Collection
Data collection gathers information. Analysis examines and interprets it.
A metaphor should respect that distinction.
Suggesting That Correlation Proves Causation
Avoid metaphors that make every relationship sound like a direct cause.
Analysis can reveal relationships, but those relationships require careful interpretation.
Overcomplicating Technical Concepts
A metaphor should make a concept easier, not create another puzzle for the reader.
Mixing Too Many Metaphors
Using a compass, spaceship, garden, ocean, and courtroom in one paragraph can make the explanation confusing.
Choose one central image and develop it consistently.
Frequently Asked Questions
What is a metaphor for data analysis?
A metaphor for data analysis is a figurative comparison that makes the analytical process easier to visualize. For example, “Data analysis is a treasure hunt” describes the search for valuable insights hidden within information.
What is a powerful metaphor for data?
“Data is a treasure map” is a powerful metaphor because it suggests that information can reveal valuable directions when interpreted correctly.
How can data analysis be described creatively?
Data analysis can be described as detective work, a treasure hunt, a puzzle, a journey, a flashlight, or a compass, depending on the concept you want to emphasize.
What metaphor describes finding patterns in data?
“Data analysis is connecting the dots” is a simple metaphor for finding relationships and patterns among individual observations.
What metaphor describes data cleaning?
“Data cleaning is polishing a mirror” works well because clean data gives analysts a clearer view of the underlying information.
Why are metaphors useful in data science?
Metaphors make technical ideas easier to understand by connecting unfamiliar concepts with familiar experiences.
Can metaphors be used in business data presentations?
Yes. Professional metaphors such as “analytics is a compass for decision-making” can make business presentations clearer without making them overly informal.
Conclusion
A strong metaphor for data analysis turns an abstract technical process into something readers can see and understand. Data can become a map, analysis can become a flashlight, patterns can become footprints, and insights can become signposts guiding better decisions.
The most effective metaphor depends on what you want to explain. Use exploration imagery when discussing discovery, cleaning imagery when discussing data preparation, puzzle imagery when explaining problem-solving, and navigation imagery when discussing decisions.
When used carefully, metaphors do more than make data analysis sound interesting—they give readers a practical mental model for understanding how information becomes insight.

My Name is Alex Gard. I’m passionate about language, creative writing, and figurative expressions. Through SmartMetaphors, I help readers discover meaningful metaphors, similes, and literary devices to make their writing more engaging and impactful.